One of the first questions that public sector and non-profit leaders need to ask when embarking on a new strategy management initiative is: "Who are the Owners of the strategy?"
Who is accountable for establishing and maintaining the objectives, measures, and initiatives that will determine whether your organization's strategy succeeds? These are the Owners. And their role is one of the most important in your organization. Whether your new strategy succeeds will depend in large part on the kind of Owners you have working to implement it.
Who is an Owner?
Being an Owner of organizational strategy is not necessarily a job title or part of a job description. Owners are leaders within the organization who act as champions for certain parts of an organization's strategy (or certain measures of the organization's Balanced Scorecard), and who oversee communication and training so that the organization's strategy becomes ingrained in the overall culture of the organization. There can be plenty of layers of supporting staff and data analysts, but the Owners are the ones who are manage and are accountable for achieving certain objectives.
The four types of Owners
Every organizational strategy has four types of owners, with responsibilities for varying areas of responsibilities:
-
Scorecard Owners set the tone for the work done by the other owners. Scorecard owners work on high-level questions such as issue definition (identifying the specific strategic issues that need to be addressed), agenda setting (deciding on a course of action for the group's activities), and meeting preparation (aligning the work of various owners and marshalling the group's latest data to discuss at the next strategy meeting).
-
Objective/Theme Owners provide analysis and commentary about the specific objectives – a finer level of detail than the overall Scorecard itself.
-
Measure Owners provide performance analysis about specific measures as outlined on the organization's Balanced Scorecard.
-
Initiative Owners provide performance analysis on strategic initiatives and help evaluate whether the organization's top projects are on track and helping deliver results.
Owner and Data Analyst: Separate but Supporting Roles
One of the most important roles of Owners, especially as it relates to the organization's Balanced Scorecard, is to ensure the most accurate data is analyzed and presented at strategy review meetings. While the owner may not be specifically responsible for the day-to-day tracking, they are responsible for the data's accuracy and the value of the analysis – and ultimately for championing the required actions in the highest circles of organizational leadership.
Each owner typically has one of more "data analysts" supporting themselves. Owners are usually not ideal for this role as it is more time consuming, more focused on collection, and is not directly related to strategic analysis or action. The data analysts collect the numbers, verify they are accurate, compile any supporting documents, and ensure the owner is knowledgeable of any emerging trends.
-
"Data Analyst" – in this role, supporting staff needs to collect updates from different parts of the organization, and tabulate and graph the data for each measure. For example, a school district might need to track student test scores, graduation rates, dropout rates, or the percentage of students going on to enroll in college. Collecting and analyzing these data is a complex task, but once the numbers are in order and emerging trends identified, the data analyst passes the information the Owner.
-
"Owner and Champion" – in the role of Owners, the champions of strategy are responsible for providing recommendations for future action based on the data compiled. Owners review the graph and investigate the underlying data to understand why the measure is behaving as it is, then suggest, act upon, and ensure strategic objectives are being acted upon.
For example, if a school district's graduation rates are down and dropout rates are up, they might analyze some of the risk factors for dropouts – has the community suffered an economic downturn, leading to increased financial stress on families? Have the demographics of the district changed in the past few years, bringing a greater proportion of students who are at higher risk of dropping out of school? Then, as champion, what can they do to ensure the organization achieves its mission? Are new programs required? Should funding or resources be realigned to meet new challenges? These are the questions and resulting actions an Owner is responsible for.
While it might seem obvious, the Owner, needs to be have the right level of authority to make changes that will drive the measure towards the intent of the organizational objective. The authority should appropriate both formally (by title and job description) and informally (authority is recognized and honored by the organization) to ensure success. Owners need to be empowered and confident that they can act and to spur change within the organization. No matter the challenge, Owners ultimately have to be able to drive the organization forward in response to the findings.
The importance of reporting: managing "small things"
In addition to these higher-profile instances of managing change in response to new data, Owners also have an important leadership role in the ongoing task of enforcing behavior and sticking to a reporting calendar.
Maintaining a solid regimen of reporting is one of the most critical tasks of the Owners. If your organization is serious about performance management and staying on track with your strategy, you need Owners who will work to ensure that the Balanced Scorecard stays relevant, that the data and analysis are accurate and result in clear decision making, and that decisions are acted upon.

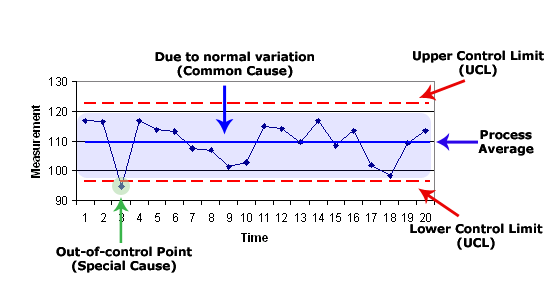 The Balanced Scorecard system typically uses a baseline, regular measurement and tracking against a target. Actual control charts might not be ideal for your Scorecard, however, the theory is still valuable